What Does Your Retirement Actually Cost? A Practical Guide for Busy Professionals
I speak with a lot of professionals who are, by any measure, doing well. Successful careers, good incomes, busy lives. And yet, when the conversation turns to retirement, there’s often a familiar pause — a slight uncertainty about whether what they’re doing right now will be enough to fund the life they actually want later.
It’s a question that deserves a straight answer. So today, I want to cut through the noise and show you, in plain terms, what different retirement lifestyles actually cost — and what you need to have saved to achieve them.
The Three Retirement Lifestyles: What Do They Really Look Like?
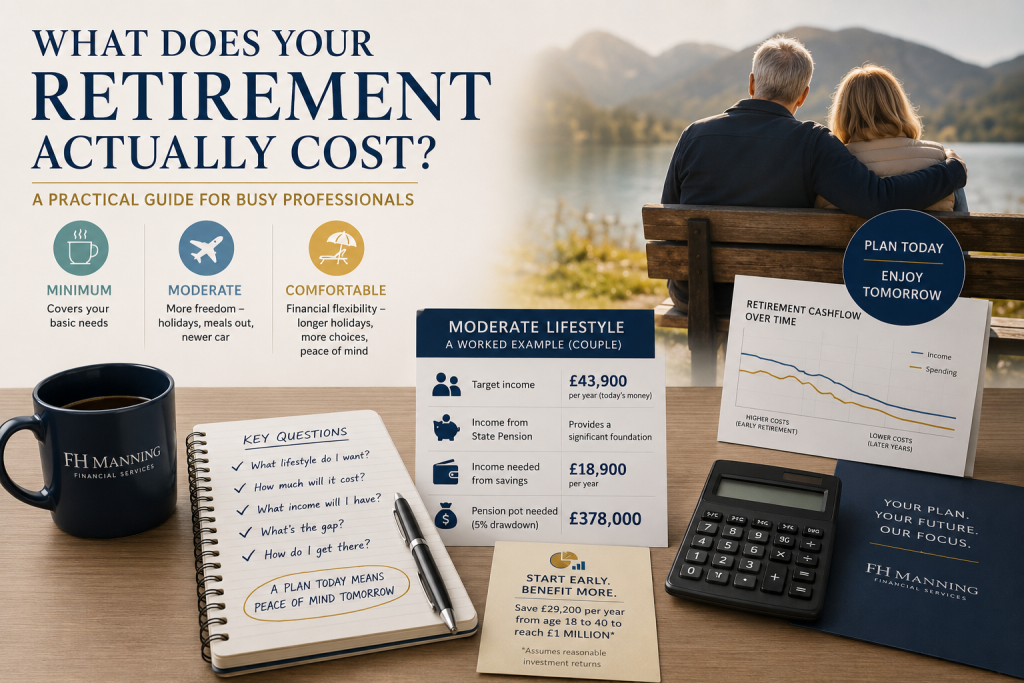
At FH Manning Financial Services, we use the Retirement Living Standards as a starting point for these conversations. It’s a research-backed framework that breaks retirement income into three tiers — minimum, moderate, and comfortable — and gives a clear picture of what each lifestyle actually involves day-to-day.
In broad terms:
- A minimum retirement covers your basic needs — food, utility bills, some social activities — but leaves little room for spontaneity.
- A moderate retirement adds more freedom: a holiday abroad each year, regular meals out, a newer car every few years. It’s comfortable without being extravagant.
- A comfortable retirement means financial flexibility — longer holidays, more generous gifts to family, and the ability to pay for things like private health care without a second thought.
For most of the professionals I work with, the moderate to comfortable tier is the target. So let’s look at what that actually requires.
The Numbers: A Worked Example
Let me walk you through a scenario we use regularly with clients.
Take a couple, both born in 1965, planning to retire at around 66. They’re aiming for a moderate lifestyle — the research suggests they’ll need a combined income of around £43,900 per year in today’s money.
With two full State Pensions providing a significant foundation, the gap they need to fill from their own savings is meaningful but very achievable with the right plan. To generate that remaining income, they’d need a combined pension pot of approximately £378,000 — that’s based on a 5% drawdown rate, which gives them roughly £18,900 per year from their pensions, with the State Pension making up the rest.
That’s the headline figure: £378,000 in pensions for a moderate retirement as a couple.
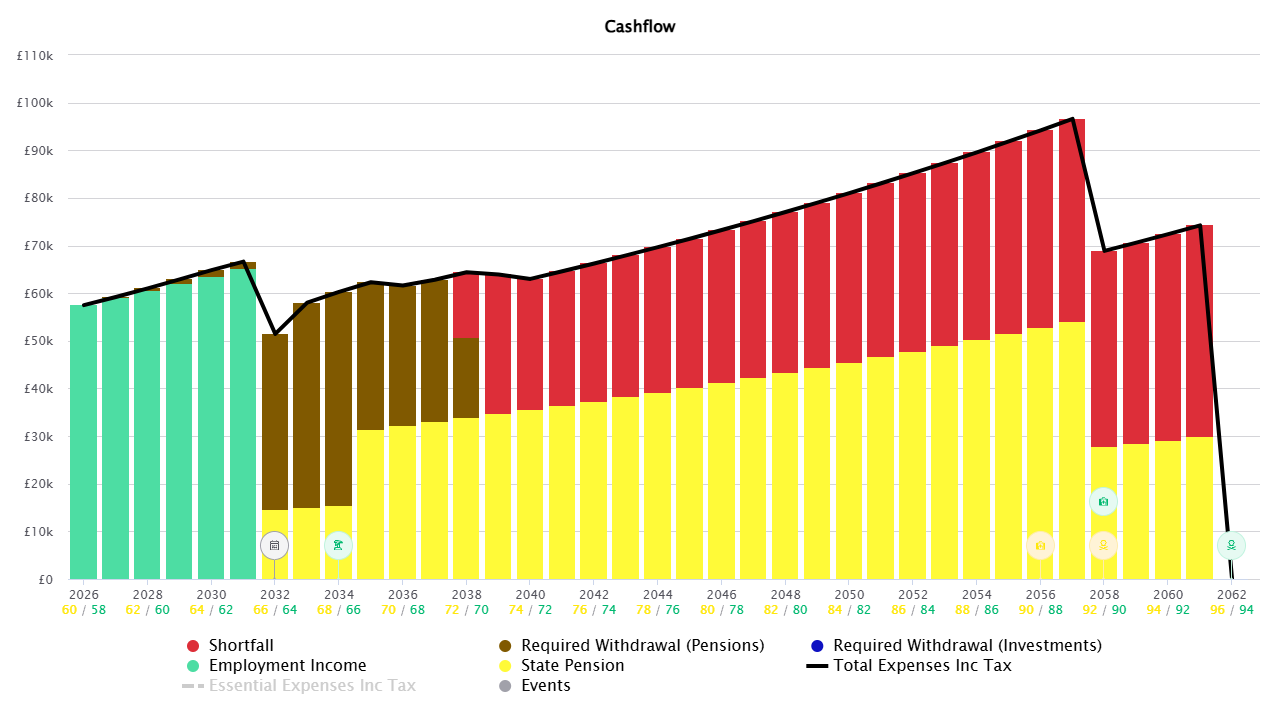
This chart shows a retirement cashflow forecast for two people (the paired ages on the x-axis suggest a couple) from 2026 to around 2062. In the early years (2026–2031), their living costs are largely covered by employment income (the teal bars). From around 2032, as they retire, that income disappears and they begin drawing on pensions (the brown bars) to cover expenses. As the years progress, State Pension (yellow) kicks in and grows to become the backbone of their income. However, a growing shortfall (red) emerges over time, meaning their expenses increasingly exceed their guaranteed income sources, requiring additional withdrawals from savings or investments. The black line represents their total expenses (rising with inflation), which peaks around 2057–2058 at roughly £95k before dropping — likely reflecting one partner passing away and household costs reducing. The widening red portion in later years is the key concern: it signals that an increasingly large chunk of their retirement spending will need to come from drawing down accumulated assets.
But here’s what I find really illuminating — the cashflow picture across their full retirement, which might span 30 years or more. In the early years of retirement, spending tends to be higher: you’re active, you’re travelling, you’re doing the things you’ve been putting off. As the decades pass, those costs shift and change. Planning for that curve — not just a flat income figure — is where proper financial planning earns its value.
The Power of Starting Early: The Million-Pound Illustration
There’s another calculation I want to share with you, because it’s one of the most striking illustrations of how time works in your favour.
If someone starts saving at 18 and continues until they’re 40, saving consistently and investing wisely, they’d need to put away approximately £29,200 per year to reach £1 million by the time they stop contributing.
That figure assumes a reasonable rate of investment return, and I’m happy to walk through the exact assumptions in a one-to-one conversation — because context matters enormously with numbers like these. The point, though, isn’t the exact figure. The point is the principle: the earlier you commit to a structured savings strategy, the less painful the monthly contribution needs to be, and the more powerfully compound growth does the heavy lifting for you.
What this also means, of course, is that for professionals who arrive at 40 or 45 without a clear plan, the catch-up required is steeper. Not impossible — not even close — but it does mean that today is always the best day to get started.
Why a Cashflow Model Changes Everything
One of the tools I use most often with clients here in Lincolnshire is a detailed cashflow model — a visual, year-by-year picture of how their money flows in and out across the whole of their retirement.
It draws together every income source: your employment income in the lead-up to retirement, your State Pension entitlement, ISAs, investments, and pension withdrawals. It then maps those against your projected expenditure — including one-off events like home renovations, family milestones, or helping children onto the property ladder.
What it reveals is often genuinely reassuring: people tend to be in a stronger position than they feared. But it also shows where the gaps are, and when. A shortfall in your mid-eighties looks very different — and requires a very different solution — from a shortfall in your early seventies.
The key insight from these models is that retirement income isn’t a single number. It’s a strategy.
What Should You Do Next?
If you’re a professional with a busy diary and a growing income, the risk isn’t that you can’t afford a good retirement — it’s that the planning keeps getting pushed to next quarter. I see it all the time, and I understand it completely.
But here’s the reality: every year you delay is a year of compound growth you can’t get back.
My recommendation is simple. Book an initial conversation with us — there’s no obligation, and it won’t take long. We’ll look at where you are, where you want to be, and map out a clear, practical route between the two. For clients who want to see their full cashflow picture across retirement, we can build that together too.
To get in touch with the team at FH Manning Financial Services in Horncastle, Lincolnshire, visit www.fhmanning.co.uk or call us to arrange your initial consultation.
Your retirement will be the longest chapter of your financial life. It deserves a plan as considered as the career that built it.
Claire Markham is a financial planning specialist at FH Manning Financial Services, based in Horncastle, Lincolnshire. FH Manning Financial Services provides independent financial advice to individuals, families and businesses across Lincolnshire and beyond. This article is for informational purposes only and does not constitute personalised financial advice. The value of investments can fall as well as rise.

Request a Free Consultation
Please click the link below to book your free consultation with one of our specialist advisers and start your path to financial freedom today.